Data analysis: from spreadsheet to script to machine learning
2026-11-16
This lecture is one dataset, taken seriously.
The dataset: every 311 call New York City logged in November 2025 — 304,905 rows, 44 columns, 258 MB of CSV.
The five questions:
The three tools: pandas and dplyr (a table you can program), an LLM (first-draft engine), and scikit-learn (pattern finding).
A spreadsheet is software. It takes input, applies transformations, produces output. But:
The same job in a script is data in a file, code in a file, and checks in a file — each one readable, diffable, and re-runnable.
311 is New York’s non-emergency line. Heat out, pothole, loud neighbor, illegal driveway blocked — you call or tap, and the city logs it.
Every call becomes one row:
Problem (formerly Complaint Type) — 174 distinct problemsThe City publishes it all as open data. We are looking at November 2025.
304,905 rows × 44 columns
nyc-311-2025.csv.xz, 179 MB compressed) has over 3.6 million rows: past Excel’s hard cap of 1,048,576. It cannot even open.You will not eyeball this. From here on, the computer summarizes and you interrogate.
read the file · filter rows · select columns · mutate new columns · group by + summarize · arrange (sort)
That is the whole grammar of today’s lecture. We will practice it on nine real rows from the 311 file — seven columns, picked because they fit on a slide (311-sample.csv ships with the deck).
| Created | Closed | Problem | Address | Borough | Status |
|---|---|---|---|---|---|
| 11/30 4:27 PM | 11/30 6:38 PM | Abandoned Vehicle | 92 NEWTON STREET | Staten Island | Closed |
| 11/30 10:18 PM | 03/11/2026 7:40 AM | For Hire Vehicle Complaint | (blank) | Unspecified | Closed |
| 11/30 11:11 PM | (blank) | Overgrown Tree/Branches | 36-04 31 AVENUE | Queens | In Progress |
| 11/30 11:29 PM | 12/01 8:40 AM | Street Condition | 95 STREET | Queens | Closed |
| 11/30 11:51 PM | 12/01 1:22 AM | Illegal Parking | 784 ARGYLE ROAD | Brooklyn | Closed |
| 11/30 11:55 PM | 12/01 12:07 AM | Noise - Residential | 249 EAST 48 STREET | Manhattan | Closed |
| 11/30 11:56 PM | 12/01 3:41 AM | Blocked Driveway | 60-52 COOPER AVENUE | Queens | Closed |
| 11/30 11:59 PM | 12/01 3:49 PM | HEAT/HOT WATER | 249 EAST 37 STREET | Brooklyn | Closed |
| 11/30 11:59 PM | 12/01 8:14 AM | Noise - Residential | 655 EAST 230 STREET | Bronx | Closed |
read — everything starts by loading the fileBoth give you the same object: a table in memory, with named columns and typed values. Nothing has happened to the data yet — that is the point.
filter — keep the rows you care aboutPython
A boolean mask selects rows: the comparison builds a true/false column, and the mask keeps the true ones.
And notice the column name: spaces, parentheses, history. Python quotes it, R backticks it — it is never bare.
select — keep the columns you care about44 columns is too many to think about. Most questions use four or five. Selecting early keeps your output — and your attention — on them.
mutate — derive new columns from old onesThe timestamps are text. To count complaints by hour, first make an hour column — by string surgery, because the format is fixed:
Python
mutate never changes the original columns — it appends. New facts about old rows, computed mechanically, so they cannot drift.
group_by + summarize — ask per-group questionsWho answers the phone in this slice?
| Agency | complaints |
|---|---|
| NYPD | 5 |
| DOT | 1 |
| DPR | 1 |
| HPD | 1 |
| TLC | 1 |
One verb turns nine rows into a fact: in this slice, the police answer the phone.
arrange — sort, then take the topNYPD answered 5 of the 9 calls; the other four agencies got one each.
Verbs compose. The pipe chains above are the same analysis written twice — which is why a second language is cheap once you can say what you want.
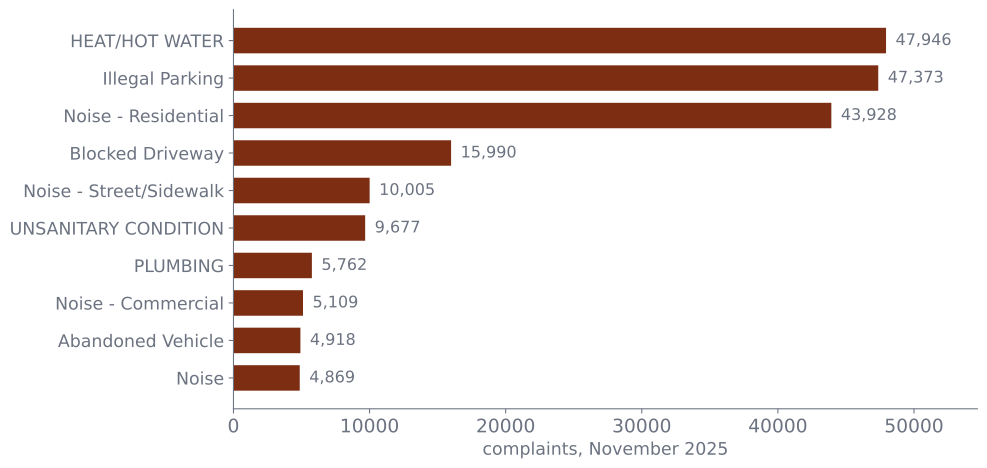
Heat/hot water: 47,946. Illegal parking: 47,373. Noise: 43,928.
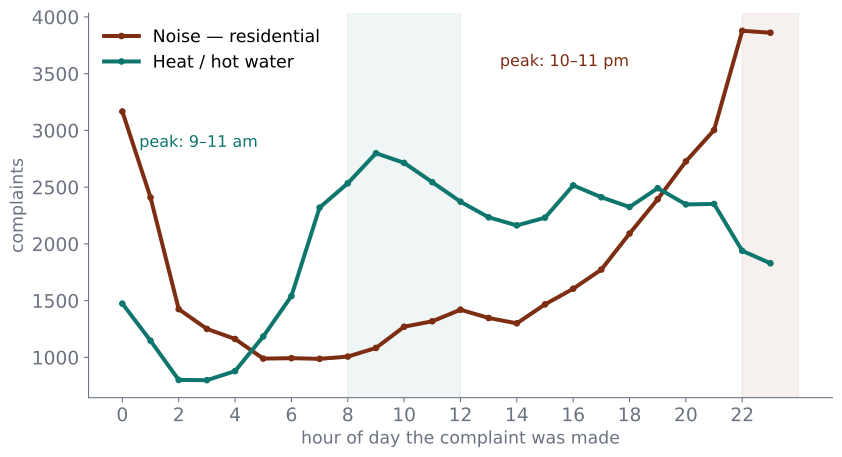
Created Date arrives as the string "11/30/2025 11:59:52 PM". Sorted as text, 9 AM comes after 11 PM. You must parse it:
Python
%I is the 12-hour clock, %p is AM/PM, %m/%d/%Y is US date order. Get one code wrong and every timestamp is wrong without an error message.
Same city, same phone number, two opposite rhythms — once the timestamps are parsed, the pattern is one group_by away.
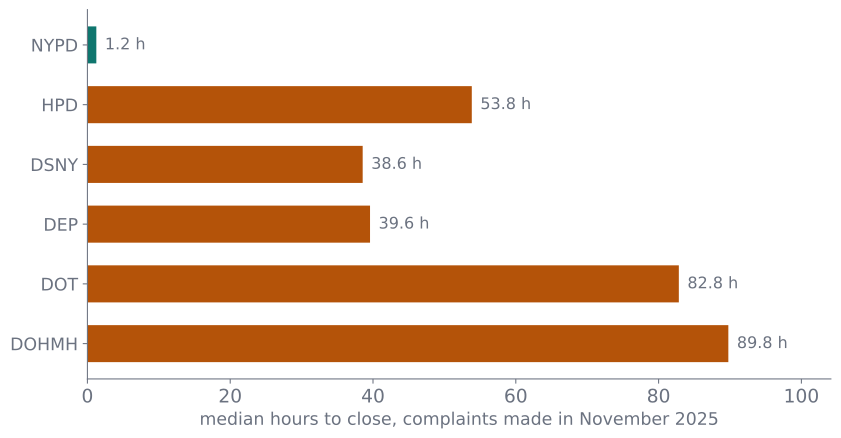
Median across all closed cases: 7.7 hours. But 4,136 cases (1.36%) are still open — no Closed Date at all. Include them and your median is not slow, it is NaN.
Python
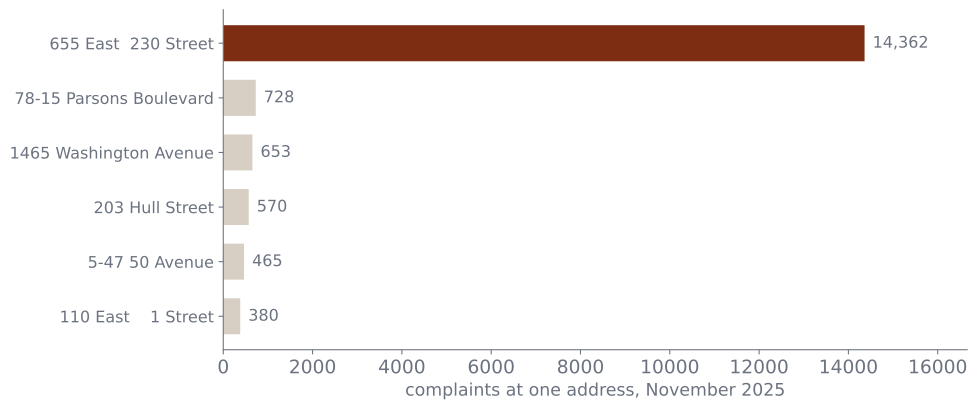
Zip code 10466 looks like the noisiest corner of the city — 17,245 complaints in November. Group by address and the story collapses: 655 East 230 Street accounts for 14,362 of them. Fourteen thousand calls in thirty days is one call every three minutes, around the clock.
Every trap in today’s file, in one place:
| Trap | Where | Size |
|---|---|---|
| Open cases with no close time | Closed Date |
4,136 rows (1.36%) |
| “Unspecified” borough | Borough |
196 rows |
| Missing coordinates | Latitude/Longitude |
~0.9% |
| One-address spam | Incident Address |
14,362 calls |
| Not-quite-UTF-8 bytes | whole file | encoding=“latin-1” |
| AM/PM text timestamps | Created Date |
every row |
None of these stopped the analysis. All of them would have silently changed its answers. First thing you do with a new file: look for the lint.
The working loop:
make check-figs.)An LLM that is right 95% of the time, verified, beats an expert who is too proud to check — and it is wrong in very predictable ways, which is next.
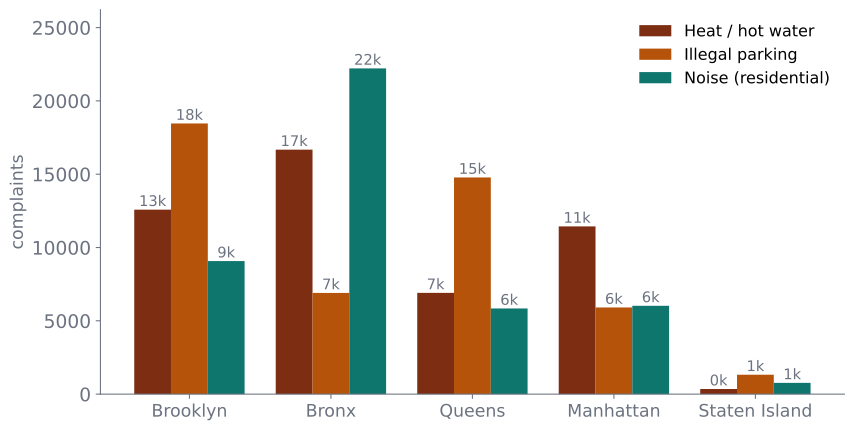
"Complaint Type" — clean, plausible, wrong. The column is Problem (formerly Complaint Type). Fix: print the column list; never let the LLM guess.Is the Bronx–Brooklyn difference from Q2 real, or noise? A chi-square test of Borough × top-5 problem type:
Python
p ≈ 0. Settled? No. With 165,000 rows, trivial differences are guaranteed “significant”. The useful question is how big: Cramér’s V = 0.21 — a real, modest difference. At this scale, effect size is the headline; p-values are the fine print.
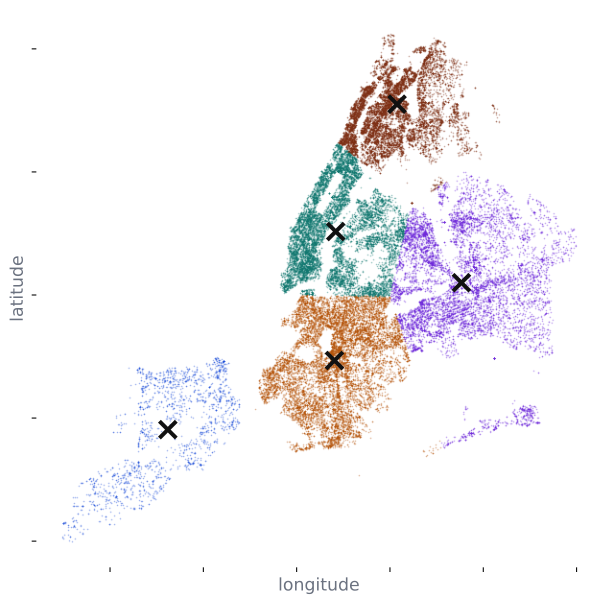
Give k-means 60,000 complaints as (latitude, longitude) pairs, nothing else, ask for 5 groups:
Python
The cluster centers land on the Bronx, Queens, Brooklyn, Manhattan, and Staten Island. Nobody told it about geography.
chisq.test, chi2_contingency).fit_predict instead of summarise.You never leave the grammar. The nouns get fancier.
CS 2010 · Data Analysis